

Dr. Shiva Ayyadurai found anomalous data when analyzing the Pima County data for mail-in ballots in the 2020 election. Shiva is a pattern recognition expert who also analyzed mail-in ballots in the Maricopa County forensic audit.
The Pima County mail-in ballot return rate was, according to Shiva, 15 percent higher than the national return rate and 19 percent higher than all other counties in the state. The anomaly shows up visually as a fishtail when the data is plotted on a graph.
 Shivas Fishtail/Dr. Shiva Addayurai/Pima County
An accurate accounting of what happened in Pima County is important because the margin of victory in the state was slim at 10,457 votes. Trump lost in Pima County by 97,223 votes. Even if the County was off by 1 percent, it would flip the election. Shiva's graphic below shows the numbers:
 Pima Could Have Flipped Election/Dr. Shiva
Dr. Shiva's Fishy Findings
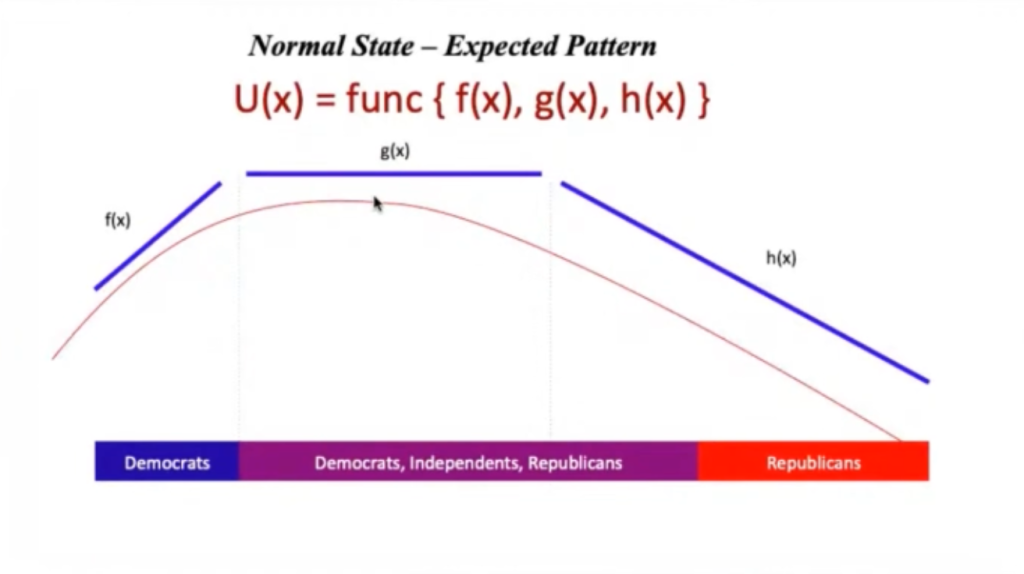
A normal state looks like the following graph, per Dr. Shiva:
 Dr. Shiva/Normal Graph
 Normal Distribution/Dr. Shiva
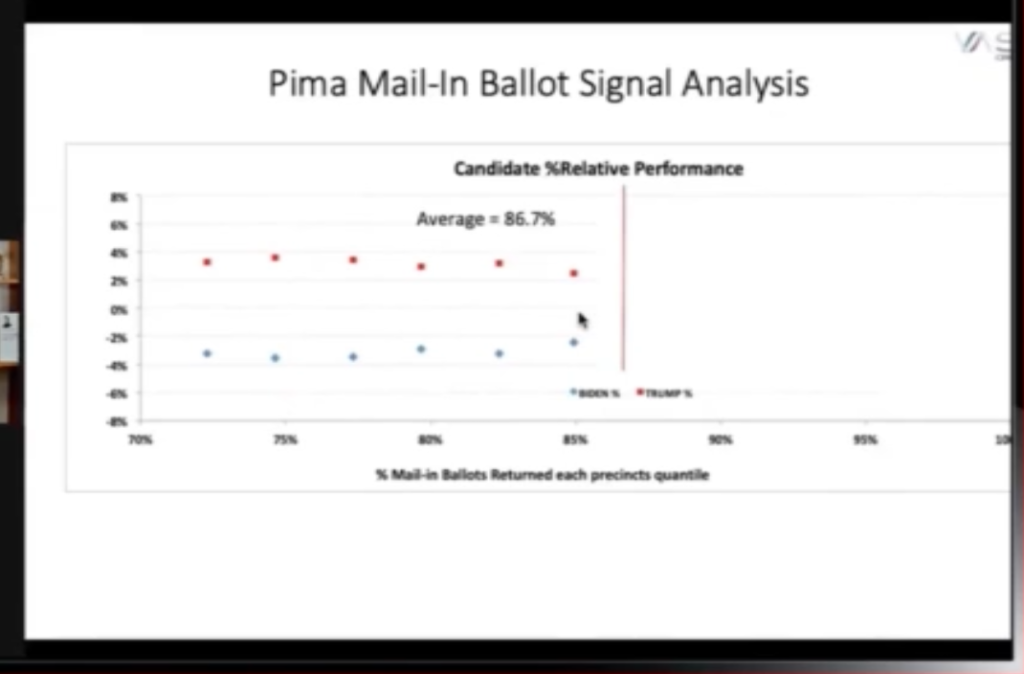
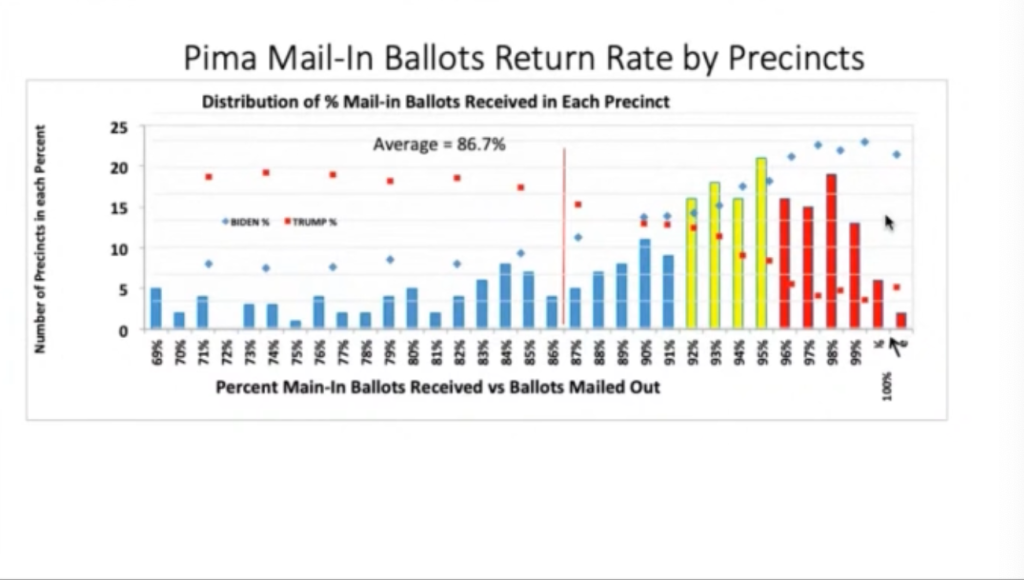
However, in Pima County, the fishtail graph emerged showing that when the data "hit the wall where ballot return rates is 86.7% we start seeing Trump's performance come down and Biden's performance go up." Shiva continues, "For every 1% increase in mail-in ballot return rates, Trump is losing 1% and Biden is gaining 1% that slope of that line," thus showing a fishtail effect on the graph. In some cases, the return rate came in at over 100 percent.
 Tipping Point/86.7 percent
 Pima Return Rate By Precinct Mail-in Ballots/Dr. Shiva
 Key Findings/Pima County/Shiva
Questions, Hypotheses, and Suggestions for Future Research
Dr. Shiva asks some objective questions based on his findings.
Questions:
- Why did Trump & Biden's performance stay steady across precincts with return rates from 65 to 85 percent?
- Why the sudden decrease in votes for Trump in precincts with higher mail-in ballot rates?
- Why is there a linear decrease and increase by 1 percent in Trump and Biden votes, respectively, as precinct return rates each increase by 1 percent, starting with precincts with 92 percent return rate?
- Why are there 2 precincts with 100 percent plus mail-in return rates?
- Why are there 40 precincts with 97 percent plus mail-in return rates?
Hypotheses:
- Did votes start flipping from Trump to Biden in precincts that have higher mail-in ballot rates above 86.7 percent?
- Did Republicans in higher mail-in ballot rate precincts vote more for Biden?
- Did Independents in higher mail-in ballot rate precincts vote more for Biden?
- Were mail-in ballots for Biden injected into the precincts with higher mail-in ballot rates (92 percent plus)?
Future Research Slide below:
 Future Research: Shiva/Pima County
Background
Rep. Mark Finchem of District 11 in Pima County has been integral to the investigation of the 2020 Election. Seven months ago, his office began to pull public records and the ballot requisition order from Runbeck, which services many elections with mail-in ballots in Arizona.
As the investigation continued, patterns of behavior around returned ballots became apparent—and some of it did not look legitimate. Finchem began to think there may be significant numbers of fictitious voters in the system—possibly 35 thousand of them. He chose Dr. Shiva to perform the analysis because of his pattern recognition background.
Finchem would like to do a census of the voter rolls in the 40 precincts in question—"particularly in the Republican voter registration group," per his Oct. 22 interview on OAN.
He has been circulating a petition to get 500,00 signatures to push for an audit in Pima County. Due to cost, it will not be a full forensic audit, but he says the investigation can target voter rolls and canvass precincts for valuable information. UncoverDC spoke with Finchem on Wednesday and he said that AG Brnovich's office "is now showing interest in Shiva's data and has requested a full report."
Pima County, a Democratic stronghold in the state of Arizona, saw 40 precincts with over 97% turn out in this election—never before happened—and one precinct, in particular, had 100.6% turn out in the November 2020 general election, according to AZ State GOP Chairwoman, Kelli Ward.
The forensic audit is over in Maricopa County and the data has been handed over to Secretary of State Mark Brnovich. Maricopa County still believes that the 2020 Election was clean and has repeatedly refuted the findings on social media. Liz Harrington's Twitter thread shows some of the back and forth between the County and Cyber Ninjas.
